
 When was the last time you did a status report for your experiential marketing campaign? Ohhhh the lowly status report, they are so easy to forget and are sometimes removed from the project completely. You get your event marketing program up and running, field staff are showing up. Your consumers are showing up and happy to try a sample. The Brand team has all of the opening jitters settled and the campaign is off and running. You don’t have to worry about reporting until it’s time for the final recap, right? Sorry… that’s just not the case.
What goes into a Status Report?
You developed an event marketing campaign strategy. In order to figure out how much it was going to cost you made some assumptions about your productivity, required staff, and hours. You also planned for where you would distribute samples, how many you would distribute, and what type of people you’d like to engage. With this information you estimated staffing costs, evaluated sponsorship costs, and identified how much gas and lodging money you would need to allocate to the Tour Manager.
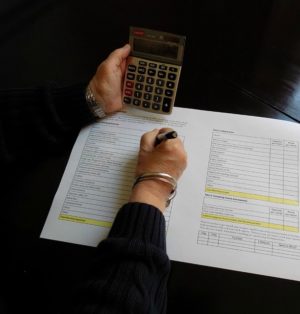
Reconcile your project costs.
Once you get the start-up logistics figured out you'll need to monitor how well you're executing against these assumptions. If you’re going to manage your program, you have to measure it.
Define your Metrics.
Here are some typical, and exceptionally actionable metrics to monitor:
- Samples per Hour. Look closely at how many samples you distribute per event hour and how this varies by market, time of day, or staff person. If you segment by these variables you’ll be able to identify best practices early on. You can use these to maximize and “manage up” your overall efficiency.
- Sampling Run Rate. Once you know your average samples per hour, you can multiply this by your total number of program hours. By doing this you can see what you are likely to net when the campaign is done. Are you at, above, or below your projections? If you’re trending below target then look for those segments that are delivering higher hourly performance and find a way to mimic that. Opposingly, if you’re trending above target you might want to try slowing things down to ensure that you do not run out of samples, or run up costs. If you’re on target, pat yourself on the back and keep your eye on things.
- Average Attendance Per Event. I have always had a hard time with attendance figures in Event Marketing Analytics simply because the data is never good. If the data point is coming from the venue manager it’s often exaggerated. They’re trying to sell sponsorships. If it’s coming from your field staff directly it’s widely inaccurate. How can one estimate the difference between 10,000 and 20,000 people while standing in vendor ally? That said, try to use what you have to figure out if low productivity (see above) is aligning with low attendance. It’s not always the case but could help shed some insights if needed.
In Review:
The ideal metrics are the metrics that are actionable. When you get your finger on the pulse of these numbers you’ll want to report on them regularly to keep everyone engaged and on top of things.
This blog is posted here: http://portma.com/status-report